Frontend Dashboard#
The LMCache Frontend Dashboard is a lightweight web UI that lets you
monitor and manage a fleet of LMCache multiprocess (MP) servers from a
single browser tab. It is shipped as part of the lmcache package and
requires no extra infrastructure beyond a small discovery service.
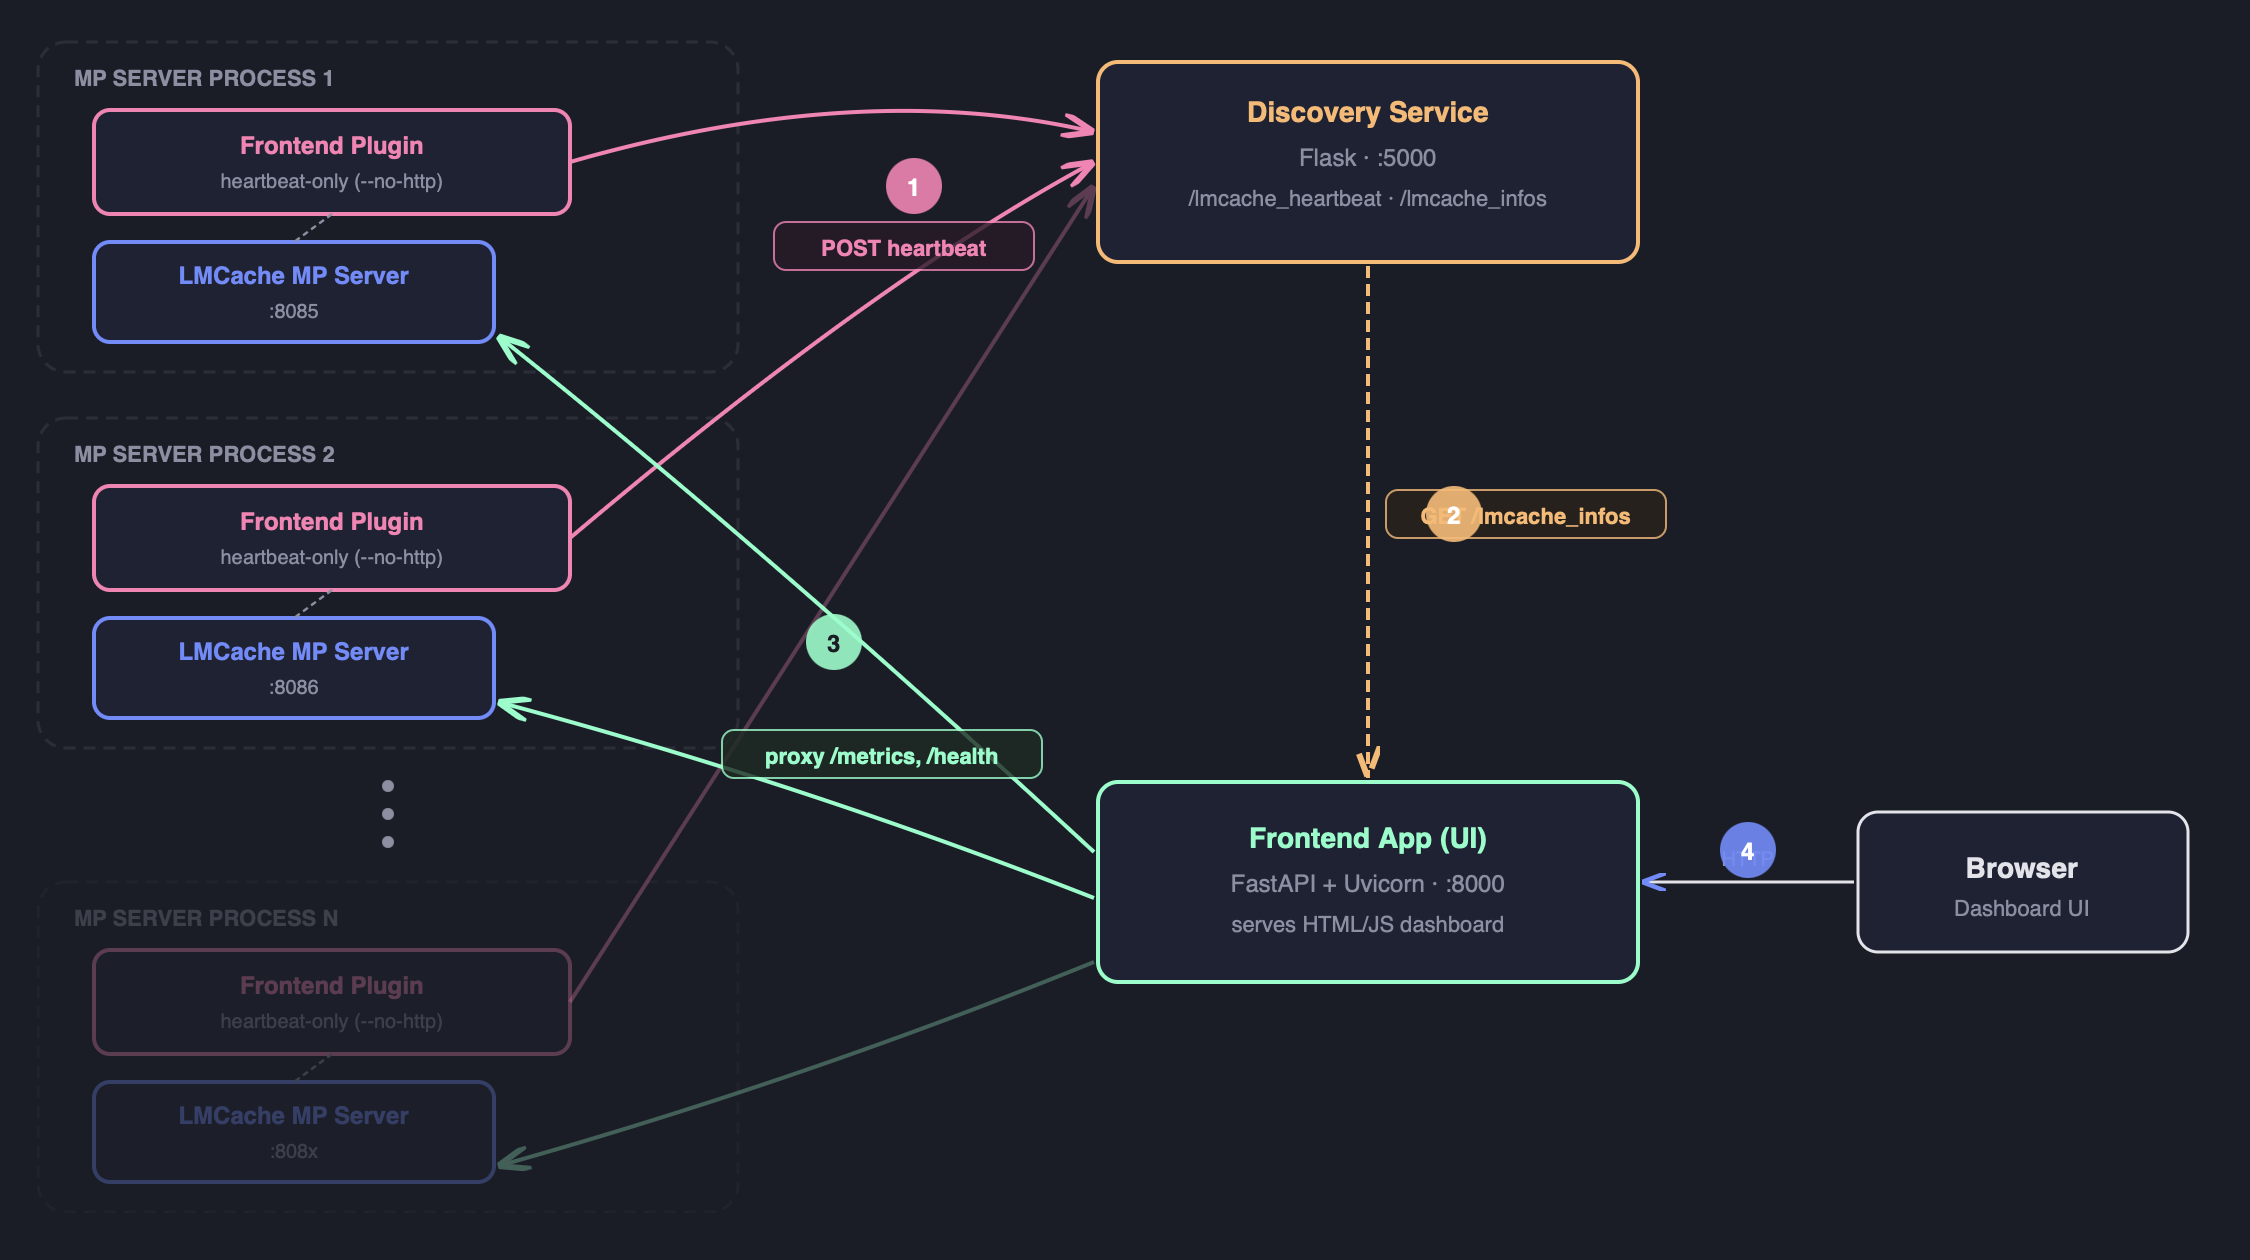
Architecture Overview#
+-----------------------------+
|  LMCache MP HTTP Server     |
|  (lmcache server)           |
|                             |
|  MPRuntimePluginLauncher    |                +---------------------------+
|    |                        |                |  simple_discover_service  |
|    +-> lmcache_mp_frontend  |   heartbeat    |  (lmcache.tools)          |
|        _plugin (subprocess) | -------------> |                           |
|        -> app.main()        |   (HTTP GET)   |  /lmcache_heartbeat       |
|           - HeartbeatService|                |  /lmcache_infos           |
|           - (--no-http)     |                +---------------------------+
+-----------------------------+                         |
                                                        | node supplier
                                                        v
                                          +---------------------------+
                                          |  Frontend Dashboard       |
                                          |  python -m lmcache.       |
                                          |  lmcache_frontend.app     |
                                          |  --node-supplier-url ...  |
                                          +---------------------------+
Each LMCache MP server runs a frontend plugin subprocess that periodically sends a heartbeat to the discovery service. The dashboard queries the discovery service to discover all live nodes and proxies their HTTP APIs through a built-in reverse proxy.
Components#
Component |
Description |
|---|---|
|
FastAPI application serving the web UI and a reverse proxy to
every registered LMCache node. Start with
|
|
Runtime plugin subprocess launched by |
|
Reference Flask discovery service. Accepts heartbeats at
|
Prerequisites#
Install the extra dependencies used by the frontend and discovery service:
pip install flask httpx fastapi uvicorn
These are not pulled in by the base lmcache install to keep it slim.
Quick Start#
Step 1 — Start the discovery service
python3 -m lmcache.tools.simple_discover_service
The service listens on 0.0.0.0:5000 and exposes:
GET /lmcache_heartbeat— record a heartbeat from an MP server.GET /lmcache_infos— return all registered nodes as JSON.
Step 2 — Start the LMCache MP server with the frontend plugin
lmcache server \
    --l1-size-gb 2 \
    --eviction-policy LRU \
    --http-host 0.0.0.0 --http-port 8085 \
    --runtime-plugin-locations \
        lmcache/lmcache_frontend/lmcache_mp_plugin/lmcache_mp_frontend_plugin.py \
    --runtime-plugin-config \
        '{"plugin.frontend.heartbeat-url": "http://localhost:5000/lmcache_heartbeat"}'
The plugin subprocess will start sending heartbeats to the discovery
service every 30 seconds (configurable via
plugin.frontend.heartbeat-interval).
Alternatively, use the provided example script:
bash lmcache/lmcache_frontend/run_mp_server_with_frontend.sh
Step 3 — Start the dashboard
python3 -m lmcache.lmcache_frontend.app \
    --port 8000 \
    --host 0.0.0.0 \
    --node-supplier-url http://localhost:5000/lmcache_infos
Open http://localhost:8000 in your browser.
Note
The dashboard auto-refreshes the node list from the supplier URL at most once every 30 seconds when the homepage is loaded.
Dashboard Features#
Node tree view — shows all proxies and their child nodes in a collapsible tree.
Metrics aggregation —
GET /metricson the dashboard aggregates Prometheus metrics from every leaf node.Reverse proxy —
/proxy2/{node_name}/{path}forwards requests to the named node, enabling direct API access from the browser.Health endpoint —
GET /healthreturns{"status": "healthy"}.
CLI Reference#
python -m lmcache.lmcache_frontend.app#
Flag |
Default |
Description |
|---|---|---|
|
|
Bind address for the dashboard HTTP server. |
|
|
Port for the dashboard HTTP server. |
|
(none) |
URL of the discovery service’s node-list endpoint, e.g.
|
|
(built-in) |
Path to a JSON config file listing proxy nodes. Used when
|
|
(none) |
Inline JSON array of node dicts, e.g.
|
|
(none) |
If set, the dashboard itself also sends heartbeats to this URL. |
|
|
Uvicorn log level ( |
|
|
Disable the HTTP server; only the heartbeat loop runs. Used internally by the MP plugin. |
Plugin Config Keys#
Pass these inside --runtime-plugin-config when launching the MP server:
Key |
Description |
|---|---|
|
(Required) Heartbeat endpoint of the discovery service. |
|
Heartbeat interval in seconds (default: |
|
Seconds to wait before the first heartbeat (default: |
Using a Custom Discovery Service#
The simple_discover_service is a reference implementation. Any HTTP
service that accepts the following GET request can be used:
GET <heartbeat_url>?api_address=<url>&pid=<int>&version=<str>&other_info=<json>
And exposes a node-list endpoint that returns JSON in the shape:
{
  "processInfos": {
    "http://host:port": {
      "lmCacheInfoEntities": [
        {"apiAddress": "http://host:port", "version": "1.0.0"}
      ]
    }
  }
}