前端仪表板#
LMCache 前端仪表板是一个轻量级的网页用户界面,允许您从一个浏览器标签页监控和管理一组 LMCache 多进程 (MP) 服务器。它作为 lmcache 包的一部分提供,不需要额外的基础设施,只需一个小型发现服务。
架构概述#
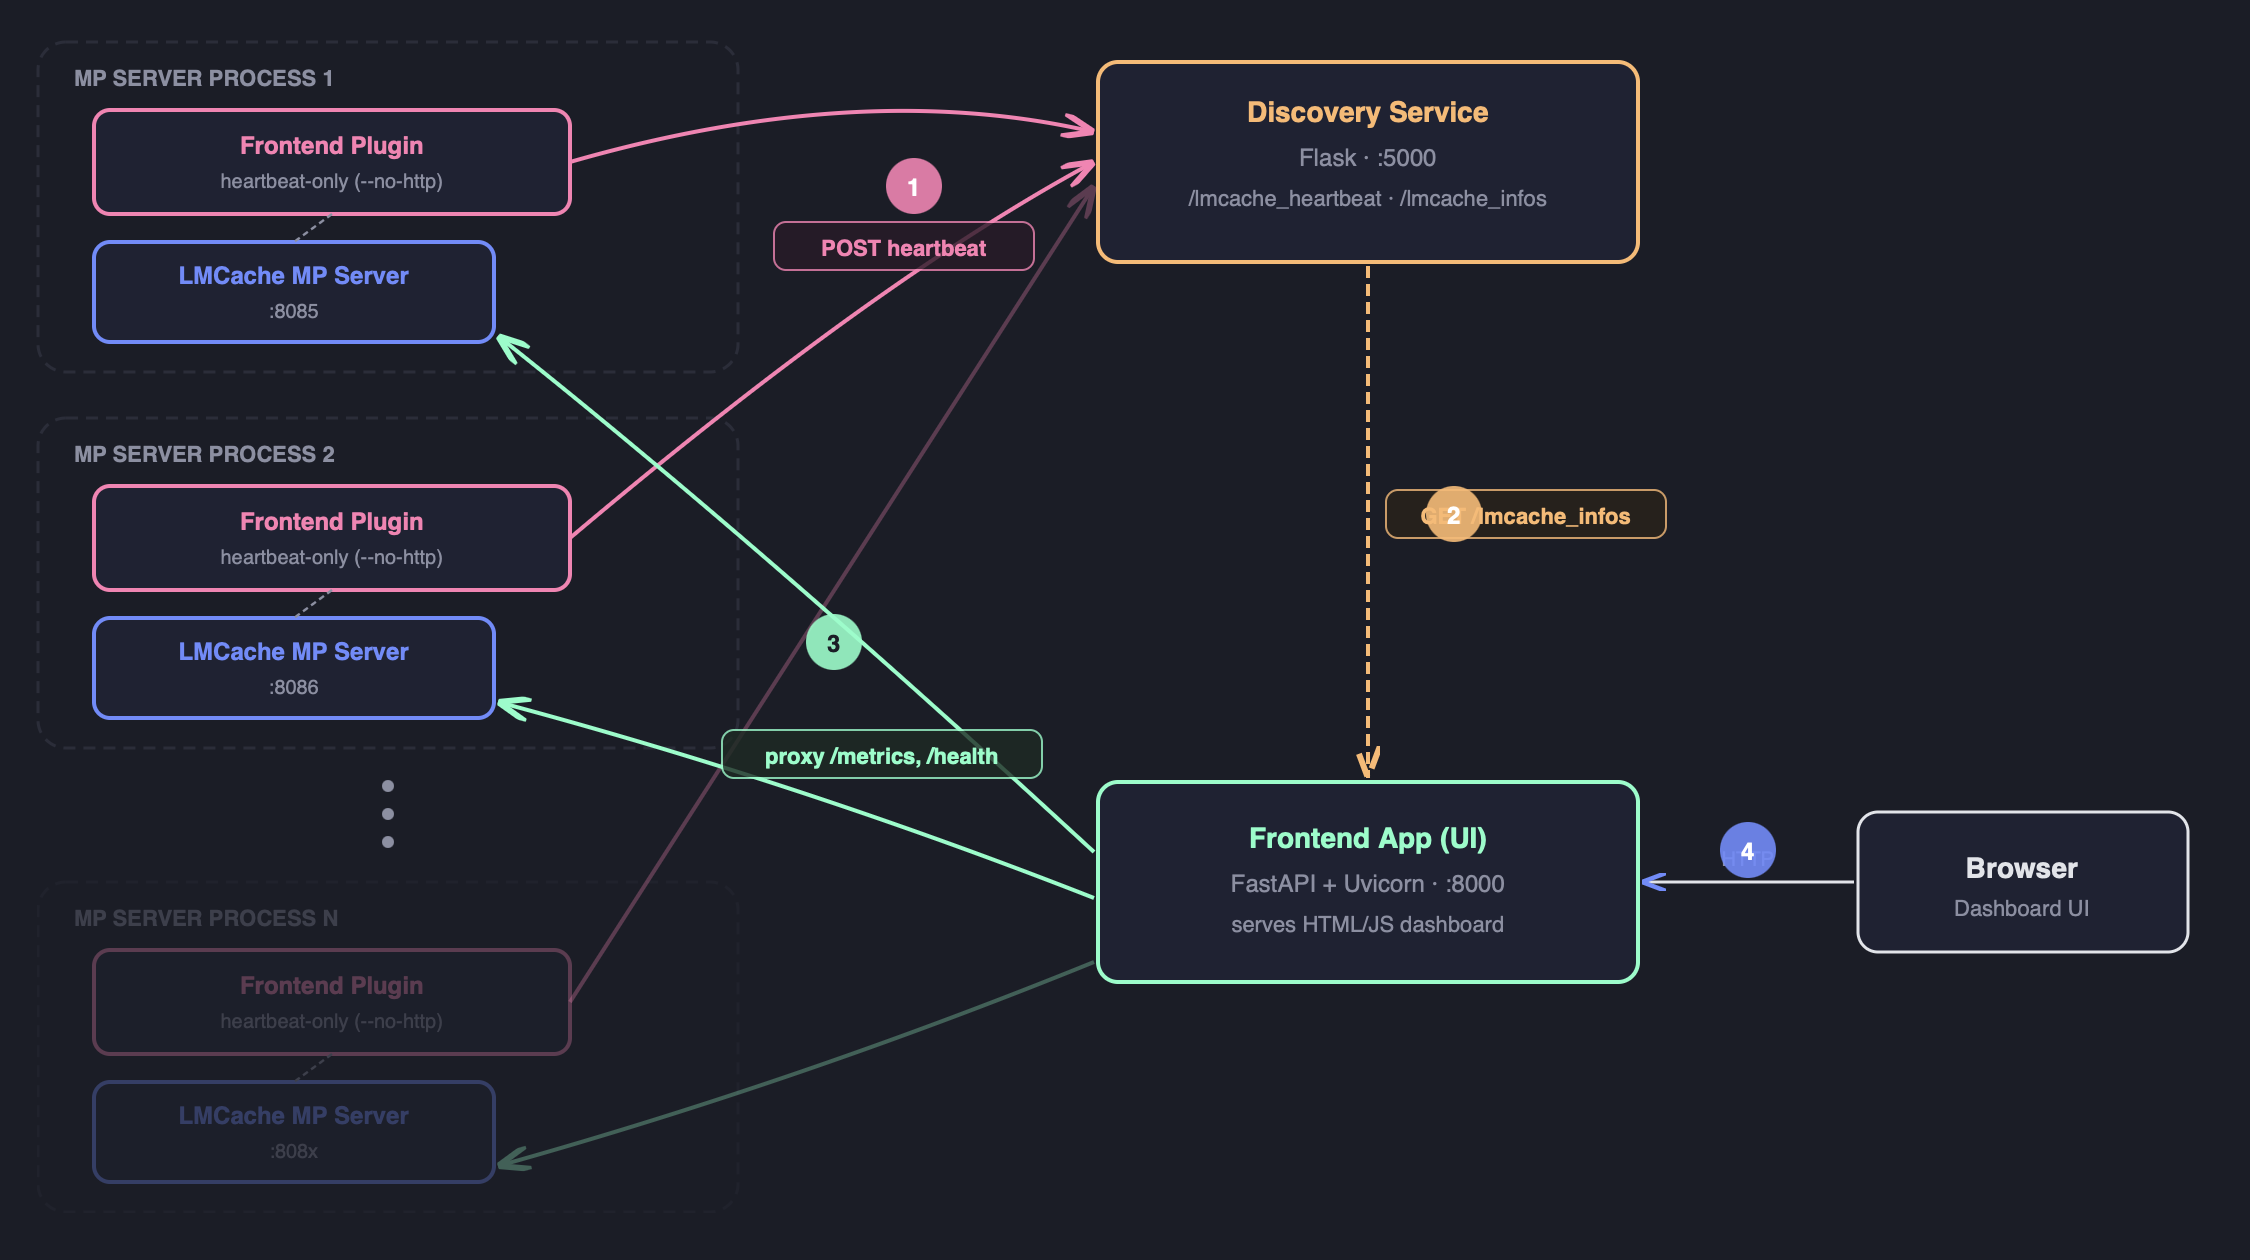
+-----------------------------+
|  LMCache MP HTTP Server     |
|  (lmcache server)           |
|                             |
|  MPRuntimePluginLauncher    |                +---------------------------+
|    |                        |                |  simple_discover_service  |
|    +-> lmcache_mp_frontend  |   heartbeat    |  (lmcache.tools)          |
|        _plugin (subprocess) | -------------> |                           |
|        -> app.main()        |   (HTTP GET)   |  /lmcache_heartbeat       |
|           - HeartbeatService|                |  /lmcache_infos           |
|           - (--no-http)     |                +---------------------------+
+-----------------------------+                         |
                                                        | node supplier
                                                        v
                                          +---------------------------+
                                          |  Frontend Dashboard       |
                                          |  python -m lmcache.       |
                                          |  lmcache_frontend.app     |
                                          |  --node-supplier-url ...  |
                                          +---------------------------+
每个 LMCache MP 服务器运行一个 前端插件子进程,定期向发现服务发送心跳。仪表板查询发现服务以发现所有活动节点,并通过内置反向代理代理它们的 HTTP API。
组件#
组件 |
描述 |
|---|---|
|
FastAPI 应用程序提供 Web UI 和每个注册的 LMCache 节点的反向代理。使用 |
|
由 |
|
参考 Flask 发现服务。接受 |
先决条件#
安装前端和发现服务所需的额外依赖项:
pip install flask httpx fastapi uvicorn
这些并不是通过基础的 lmcache 安装引入的,以保持其精简。
Quick Start (all-in-one on localhost)#
The steps below spin up the discovery service, the LMCache MP
server and the dashboard on a single machine and glue them
together with localhost. Open three terminals and run one command
in each.
Endpoint cheat sheet used throughout this section:
Discovery service:
http://localhost:5000LMCache MP HTTP server:
http://localhost:8085Dashboard UI:
http://localhost:8000
步骤 1 — 启动发现服务
python3 -m lmcache.tools.simple_discover_service --port 5000
This binds to 0.0.0.0:5000 by default. To pick a different
interface or port, pass --host / --port (e.g.
--port 5001); if you change the port, remember to update the
URLs in Step 2 & 3 accordingly.
The service exposes:
GET /lmcache_heartbeat— 记录来自 MP 服务器的心跳。GET /lmcache_infos— 以 JSON 格式返回所有注册的节点。
Verify it is up:
curl http://localhost:5000/lmcache_infos
步骤 2 — 启动带有前端插件的 LMCache MP 服务器
重要
--runtime-plugin-locations accepts either a relative path
(resolved against the current working directory) or an
absolute path. The command below uses a relative path, so it
must be run from the repository root. Otherwise you will see:
LMCache WARNING: Runtime plugin location
lmcache/lmcache_frontend/lmcache_mp_plugin/lmcache_mp_frontend_plugin.py
does not exist
and no heartbeat will be sent. Either cd into the repo root
first, or replace the plugin path with an absolute one such as
$(pwd)/lmcache/lmcache_frontend/lmcache_mp_plugin/lmcache_mp_frontend_plugin.py
(evaluated from the repo root) or a fully-qualified path
/abs/path/to/LMCache/lmcache/lmcache_frontend/lmcache_mp_plugin/lmcache_mp_frontend_plugin.py.
# Run from the repository root of LMCache.
cd /path/to/LMCache

lmcache server \
    --l1-size-gb 2 \
    --eviction-policy LRU \
    --http-host 0.0.0.0 --http-port 8085 \
    --runtime-plugin-locations \
        lmcache/lmcache_frontend/lmcache_mp_plugin/lmcache_mp_frontend_plugin.py \
    --runtime-plugin-config \
        '{"plugin.frontend.heartbeat-url": "http://localhost:5000/lmcache_heartbeat", "plugin.frontend.report-host": "127.0.0.1"}'
The plugin subprocess sends a heartbeat to the discovery service every
30 seconds (configurable via plugin.frontend.heartbeat-interval).
重要
Why ``plugin.frontend.report-host: 127.0.0.1`` matters for local dev.
By default the plugin calls get_local_ip() to guess a
non-loopback IPv4 to put into the reported api_address. On a
developer laptop that guess is often a NIC/VPN address that is
not reachable from the dashboard side (Wi-Fi switched off,
split-tunnel VPN, macOS firewall, etc.), so
http://localhost:5000/lmcache_infos will list an
apiAddress that the dashboard cannot connect to.
Setting plugin.frontend.report-host to 127.0.0.1 bypasses
the auto-detection and forces the reported address to
http://127.0.0.1:8085, which is always reachable on the same
machine. For multi-host deployments, set it to the real IP or
hostname that the dashboard should use to reach this server, or
leave it unset to keep auto-detection.
Verify the heartbeat landed:
curl http://localhost:5000/lmcache_infos
# Expect: processInfos -> "http://127.0.0.1:8085": { ... }
Alternatively, use the provided example script (accepts the
REPORT_HOST env var):
REPORT_HOST=127.0.0.1 \
    bash lmcache/lmcache_frontend/run_mp_server_with_frontend.sh
步骤 3 — 启动仪表板
python3 -m lmcache.lmcache_frontend.app \
    --port 8000 \
    --host 0.0.0.0 \
    --node-supplier-url http://localhost:5000/lmcache_infos
Open http://localhost:8000 in your browser. The dashboard fetches
the node list from the discovery service and reverse-proxies to each
node's apiAddress — with report-host set to 127.0.0.1
above, this always resolves back to the local MP server on
:8085.
备注
仪表板在加载主页时,最多每 30 秒自动从供应商 URL 刷新一次节点列表。
仪表板功能#
节点树视图 — 显示所有代理及其子节点,以可折叠的树形结构呈现。
指标聚合 —
GET /metrics在仪表板上聚合来自每个叶节点的 Prometheus 指标。反向代理 —
/proxy2/{node_name}/{path}将请求转发到指定节点,使浏览器能够直接访问 API。健康端点 —
GET /health返回{"status": "healthy"}.
CLI 参考#
python -m lmcache.lmcache_frontend.app#
标志 |
默认 |
描述 |
|---|---|---|
|
|
仪表板 HTTP 服务器的绑定地址。 |
|
|
仪表板 HTTP 服务器的端口。 |
|
(无) |
URL to fetch node information from, e.g.:
|
|
(内置) |
代理节点的 JSON 配置文件路径。当未设置 |
|
(无) |
节点字典的内联 JSON 数组,例如 |
|
(无) |
如果设置,仪表板本身也会向此 URL 发送心跳。 |
|
(auto) |
Host reported in the heartbeat |
|
|
Uvicorn 日志级别 ( |
|
|
禁用 HTTP 服务器;仅运行心跳循环。由 MP 插件内部使用。 |
插件配置键#
在启动 MP 服务器时,将这些放在 --runtime-plugin-config 中:
键 |
描述 |
|---|---|
|
(必需) 发现服务的心跳端点。 |
|
心跳间隔(单位:秒,默认值: |
|
在第一次心跳之前等待的秒数(默认值: |
|
Host reported in the heartbeat |
使用自定义发现服务#
simple_discover_service 是一个参考实现。任何接受以下 GET 请求的 HTTP 服务都可以使用:
GET <heartbeat_url>?api_address=<url>&pid=<int>&version=<str>&other_info=<json>
并暴露一个节点列表端点,该端点返回形状为 JSON 的数据:
{
  "processInfos": {
    "http://host:port": {
      "lmCacheInfoEntities": [
        {"apiAddress": "http://host:port", "version": "1.0.0"}
      ]
    }
  }
}